UK Train Rides Analysis
Project details
Introduction
Understanding train ride patterns, delays, and passenger numbers is crucial for improving the efficiency and reliability of train services in the UK.
Objective: The primary aim of this analysis is to uncover key insights and trends within the UK train rides data. This includes identifying patterns in delays, peak travel times, popular routes and ticket types.
Scope: This analysis focuses on various aspects such as train schedules, delays, routes, and ticket prices to provide a comprehensive overview of UK train rides.
Code Access: If you are interested in viewing the analysis code, it is available on GitHub. Click here to access the code.
Data Source
The dataset used for this analysis contains detailed information on UK train rides. It includes data on various aspects such as train schedules, delays, routes, and ticket types.
Origin: The dataset was sourced from Maven Analytics, a platform that provides various datasets for data analysis and learning purposes.
Purpose: This analysis serves as a playground project to gather feedback from the Maven Analytics community on my data analysis skills and insights.
License: The dataset is provided by Maven Analytics for educational and analytical purposes. Ensure to review and comply with any specific licensing terms stated on their platform.
Example:

Cleaning and Preparing the Data
Initial Inspection: The dataset initially contained several missing values and some outliers that needed to be addressed.
Handling Missing Values: Missing values were handled by using techniques such as imputation and removal of rows/columns with excessive missing data.
Data Transformation: Several features were transformed to improve their suitability for analysis. This included:
- Extracting Departure Hour: The departure hour was extracted from the departure time to analyze hourly patterns in train departures.
- Calculating Delay: The delay in minutes for each trip was calculated by finding the difference between the actual arrival time and the scheduled arrival time.
Tools Used: The Python libraries used for data cleaning included Pandas for data manipulation and cleaning, NumPy for numerical operations, and Matplotlib for initial exploratory data analysis.
Example:
What Are The Most Popular Routes?
Objective: To determine the most popular routes based on passenger numbers.
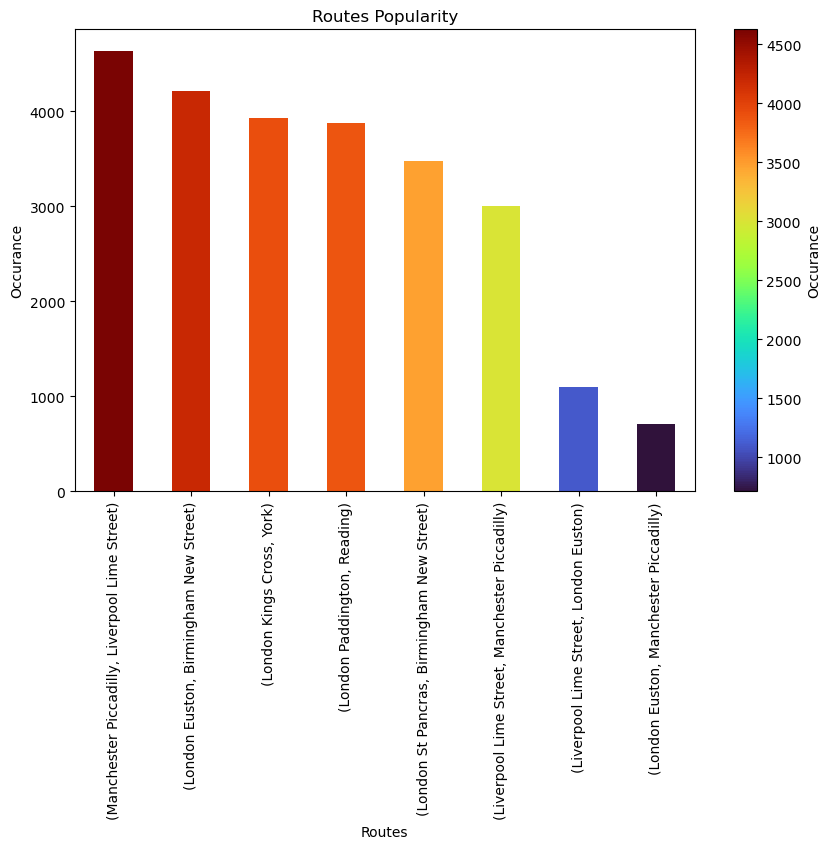
Method: The data was grouped by routes and the total number of passengers for each route was calculated. Initially, there were 65 routes, but for better visualization, we narrowed it down to the top 8 routes. A bar chart was used to visualize the top routes.
Findings:
- Top 8 Routes:
- Manchester Piccadilly to Liverpool Lime Street
- London Euston to Birmingham New Street
- London Kings Cross to York
- London Paddington to Reading
- London St Pancras to Birmingham New Street
- Liverpool Lime Street to Manchester Piccadilly
- Liverpool Lime Street to London Euston
- London Euston to Manchester Piccadilly
Insights: The analysis reveals that route originating from Manchester Piccadilly to Liverpool Lime Street are the most popular, indicating a high volume of travel (4628 trip).
What Are The Peak Travel Times?
Objective: To identify peak travel times based on departure hours.
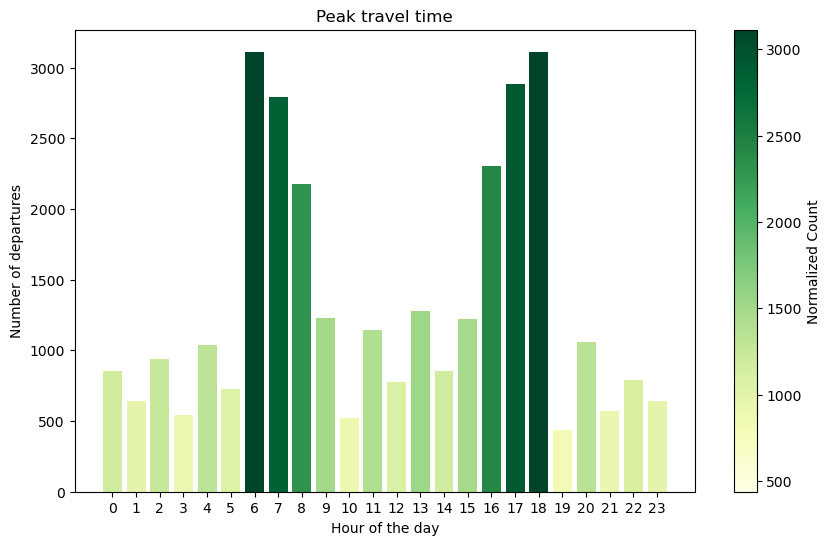
Method: The data was grouped by departure hour and the total number of passengers for each hour was calculated. A bar chart was used to visualize the data and highlight peak travel times.
Findings:
- Peak Travel Hours:
- Morning peak: 6 AM - 8 AM
- Evening peak: 4 PM - 6 PM
Insights: The analysis indicates that the highest volume of passengers travel during the morning and evening peak hours, which aligns with typical commuting patterns.
How does revenue vary by ticket types and classes?
Objective: To examine how revenue is distributed across different ticket types and classes.
Method:
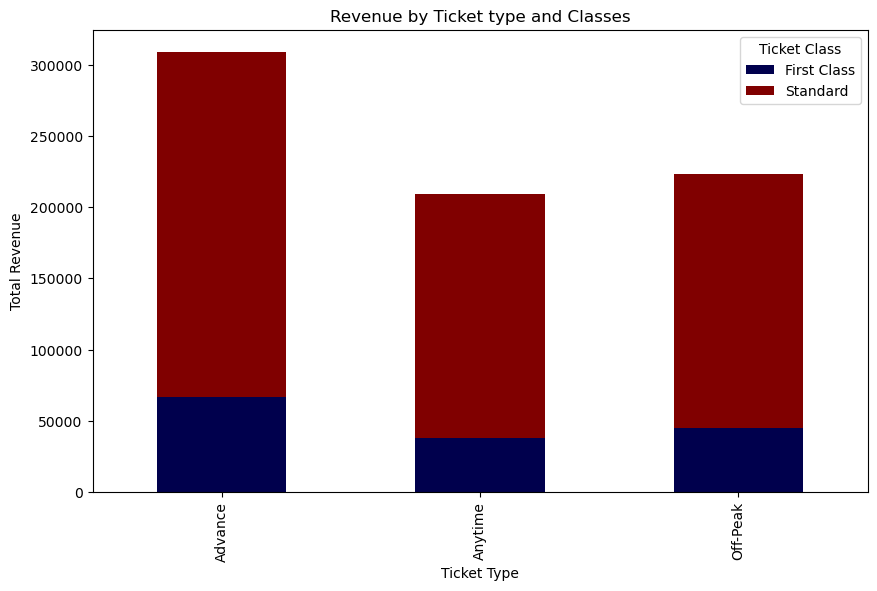
- Grouping Data: The data was grouped by ticket types (Advance, Anytime, Off-Peak) and classes (Standard, First Class).
- Calculating Revenue: Total revenue for each category was calculated.
- Visualization: Data was visualized using bar graphs to show the proportion of revenue from each category.
Findings:
- Revenue by Ticket Types:
- Advance: 309,274 £
- Anytime: 209,309 £
- Off-Peak: 223,338 £
- Revenue by Classes:
- Standard: 592,522 £
- First Class: 149,399 £
Insights:
- The majority of revenue comes from Advanced - Standard tickets.
- First class, while less frequent, contribute significantly to overall revenue due to higher prices.
What is the on-time performance?
Objective: To evaluate the on-time performance of train rides based on actual and scheduled arrival times.
Method:
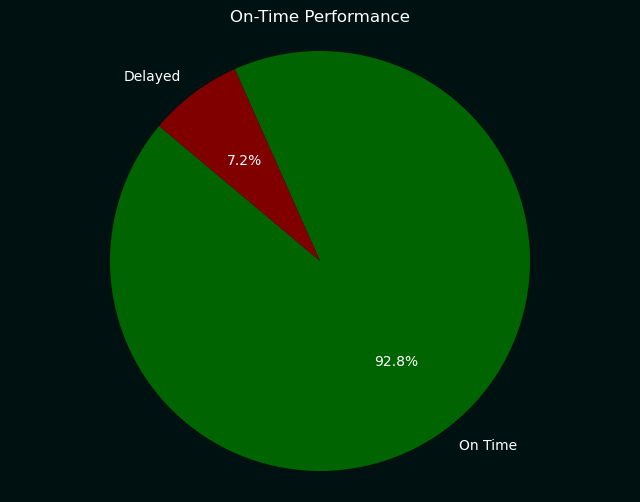
- Calculating On-time Percentage And Delayed Percentage : On-time performance was assessed by calculating the percentage of train rides that arrived on time and the others that got delayed based on the Journey Status.
- Visualization: Data was visualized using pie chart to show the the difference between on-time arrivals and delayed trips.
Findings:
- On-time Percentage: 92.8% of train rides arrived within On-Time of their scheduled time.
- Delayed Percentage: 7.2% of train rides got delayed of their scheduled time.
Insights:
- The analysis indicates a high on-time performance depending on the specific criteria used.
- Insights into potential factors affecting on-time performance can be further explored, such as route congestion or weather conditions.
What are the main contributing factors?
Objective: To identify and analyze the primary factors affecting the on-time performance of train rides.
Factors:
- Weather
- Weather Conditions
- Technical Issue
- Signal failure
- Staff Shortage
- Staffing
- Traffic
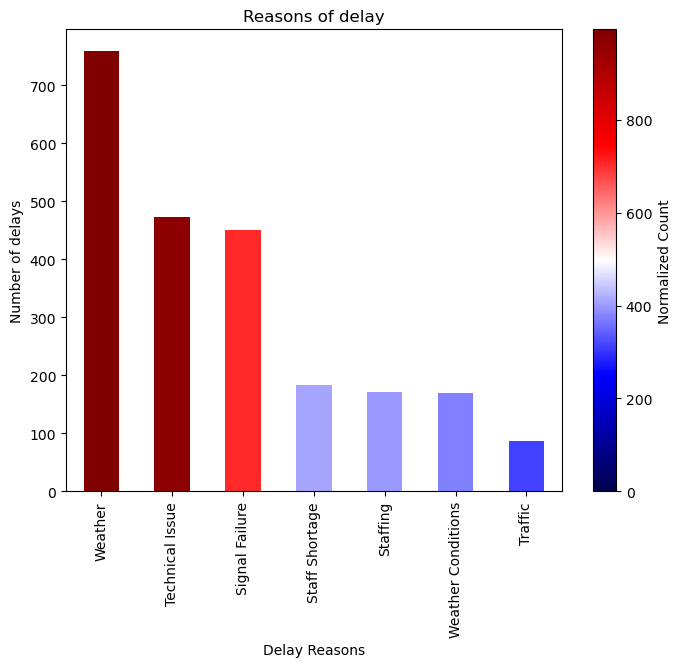
Findings:
- The most common factor affecting on-time performance is adverse weather.
Insights:
- Understanding these factors helps in implementing strategies to improve on-time performance.
- Recommendations include investing in infrastructure, enhancing maintenance protocols, and improving communication with passengers.
Delay Causes and Duration
Objective: To analyze the duration of train delays categorized by different reasons.
Method:
- Categorization: Delays were categorized by reasons such as weather conditions, technical issues, and signal failure.
- Total Delay Times: Total delay times were calculated for each category (in minutes).
- Visualization: Data was visualized using bar charts to show the average delay times for each reason.
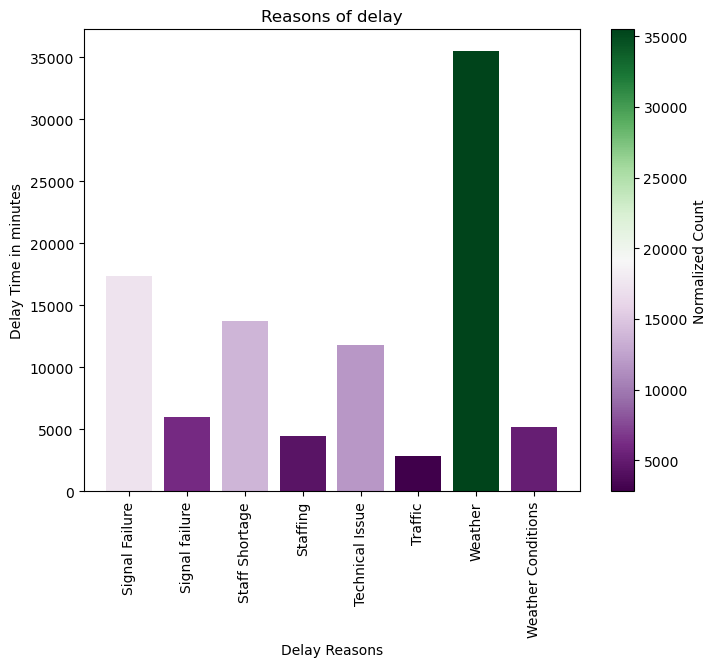
Findings:
- Weather : Total delay of 35,480 minutes (591 hours) due to adverse weather.
- Technical Issues: Total delay of 11,761 minutes (196 hours) caused by equipment failures.
- Signal Failure: Total delay of 23,367 minutes (489 hours) due to Signal Failure.
Insights:
- Weather-related delays constitute the majority of extended delays.
- Addressing technical issues promptly can reduce overall delay times.
- Managing Signal Failure is crucial for maintaining punctuality.
Peak Departure Times for Delays
Objective: To analyze the distribution of delays based on departure times.
Method:
- Grouping Delays: Delays were grouped by departure times, such as morning rush hour or evening commute.
- Frequency and Duration: Frequency and Total duration of delays were calculated for each time period.
- Visualization: Data was visualized using a bar chart to show the distribution of delays across different departure times.

Findings:
- Peak delays occur during the morning rush hour and late afternoon.
- Total delay duration is longer during peak commuting times compared to off-peak hours.
Insights:
- Understanding peak departure times helps in implementing targeted strategies to reduce delays during high-demand periods.
- Improving schedule adjustments and infrastructure capacity during peak times can enhance punctuality.
Departure Stations Causing Delays
Objective: To identify the departure stations where delays are most frequent.
Method:
- Analysis: Delays were analyzed based on departure stations.
- Frequency: Frequency of delays were calculated for each station.
- Visualization: Data was visualized using bar charts to show the stations with the most delays.
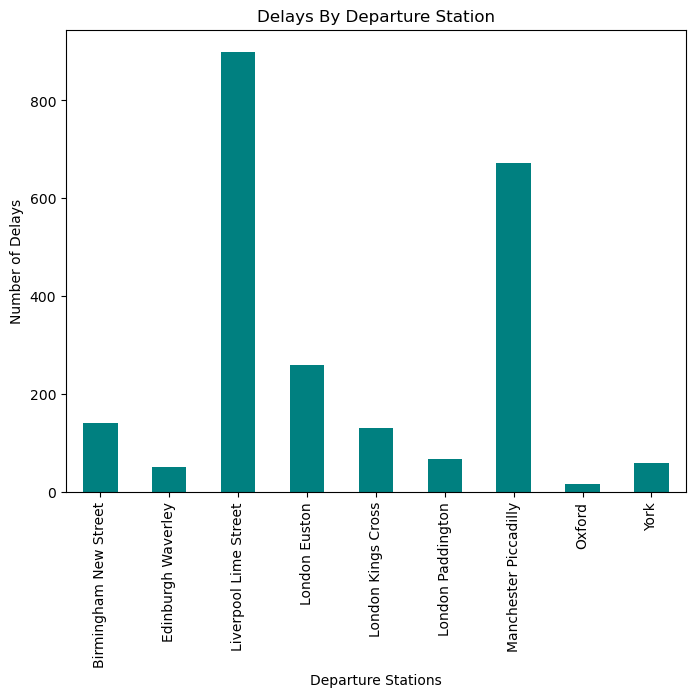
Findings:
- Liverpool Lime Street station has the highest frequency of delays.
- Manchester Piccadilly station follows closely
Insights:
- While London Euston is not the first or second in terms of delay frequency, it is believed to be one of the most significant contributors to delays. This will be explained further in the following sections.
- Understanding which stations experience the most delays helps prioritize improvements in infrastructure and operational management.
- Implementing targeted strategies at these stations can mitigate delays and improve overall service reliability.
Arrival Destinations Causing Delays
Objective: To identify the arrival destinations with the highest impact on delays
Method:
- Calculation: Frequency of delays were calculated for each arrival destination.
- Identification: The destinations with the highest overall delay impact were identified.
- Visualization: Data was visualized using bar charts or tables to illustrate the impact.
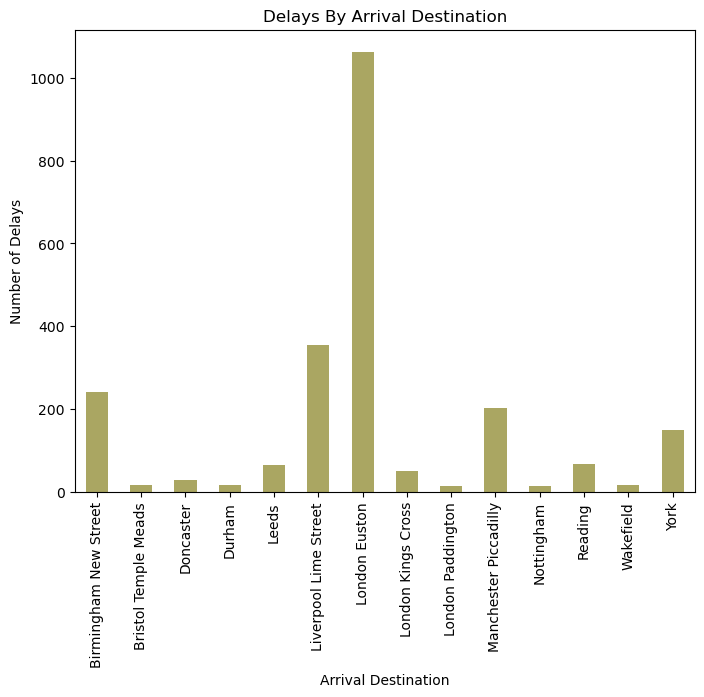
Findings:
- Destination London Euston has the highest frequency of delays.
- Destination Liverpool Lime Street follows.
Insights:
- Identifying the destinations with the most delays helps in targeting specific improvements.
- Implementing strategies to reduce delays at these destinations can enhance overall service reliability.
- Further analysis on contributing factors at these destinations can provide more actionable insights.
London Euston
While London Euston is not the most popular , it is believed to be one of the most significant contributors to delays. lets see that
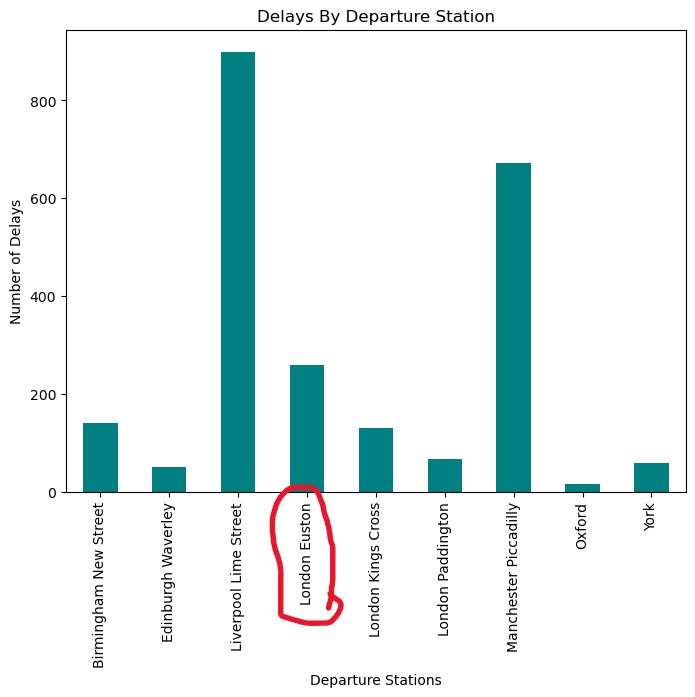
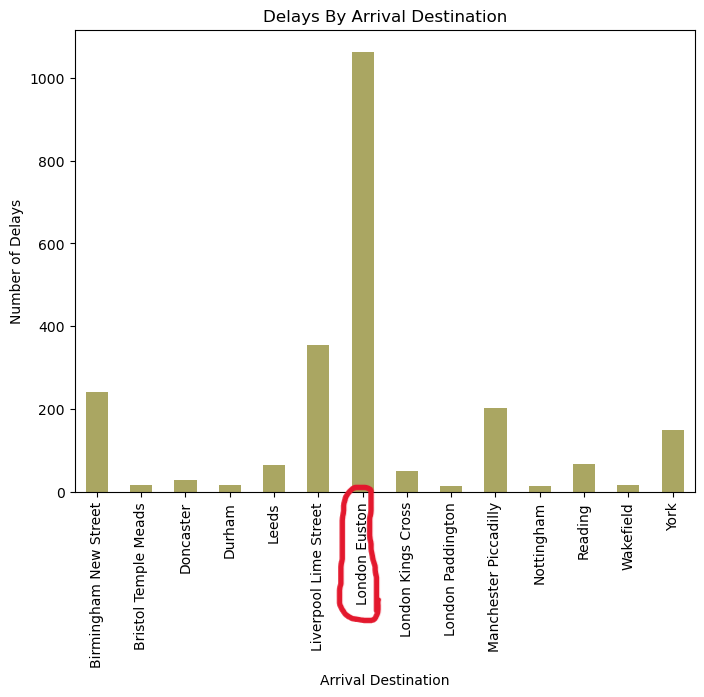
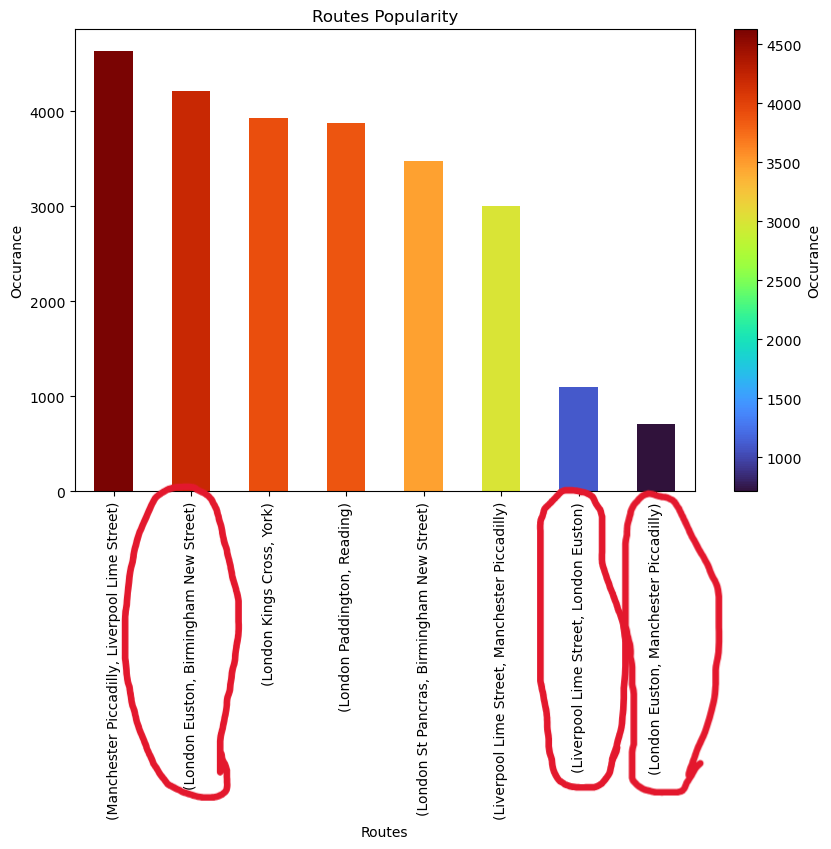
As you can see, London Euston station is related to all our visualizations that involve stations, indicating its significant impact on delays. This consistent appearance across different analyses highlights its role as a major contributor to delays, making it a critical area for targeted improvements to enhance overall service reliability.
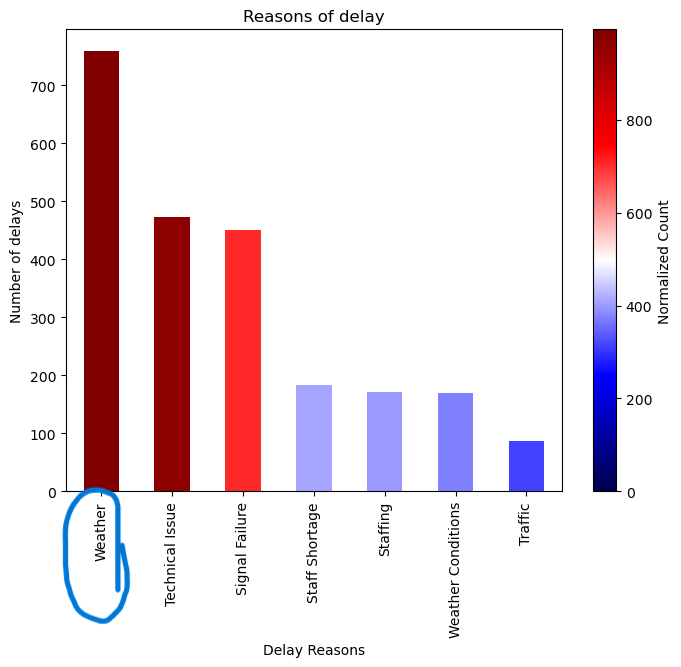
As we saw in the analysis of delay reasons, weather is a significant factor. Let's explore how this relates to London Euston station.
The Relationship Between London Euston and Weather-Related Delays
Objective: To analyze the impact of weather-related delays on London Euston station.

Findings:
- Frequency: Weather-related delays occur frequently at London Euston station (92%) , affecting operational efficiency. Also weather is the most cause of the delay in general.
- Duration: These delays often result in extended wait times and disruptions to schedules.
- Comparison: London Euston station experiences weather-related delays more prominently compared to other stations in the dataset, Which it affects other stations.
Insights:
- Weather conditions significantly influence the punctuality and reliability of services at London Euston.
- Mitigating weather-related delays requires robust contingency plans and infrastructure investments.
- Understanding these dynamics is crucial for improving overall service resilience and customer satisfaction.
Conclusion
In conclusion, our analysis of UK train ride data from Maven Analytics has provided valuable insights into various aspects of operational performance and challenges. We began by exploring the sources and preparation of our dataset, followed by detailed examinations of popular routes, peak travel times, revenue variations by ticket types and classes, on-time performance, delay factors, and the specific impact of London Euston station on overall service reliability.
Key findings include the identification of critical routes and stations contributing to delays, the influence of weather on operational efficiency—particularly evident at London Euston—and recommendations for targeted improvements to enhance service quality and customer satisfaction.
By delving into these metrics and relationships, we aim to support ongoing efforts to optimize railway operations, mitigate delays, and ensure a seamless travel experience for passengers across the UK.


